A Big Data Case Study (or, When To Stop Developing)
Recently a client came to me for assistance with analysing an invoice they had received. They are an Engineer whose client was applying for resource consent.
Without going into to much detail, my client believed that the time spent for what should have been a simple job was too high, and that his client could save money by disputing the costs. Ultimately he wanted the invoice broken down in different ways to check how much time was spent on various stages of the process.
The Data Warehouse
As usual when working with client data, it didn’t come in a great format, just a PDF containing a table of invoice lines. My first job would need to be to create a data pipeline.
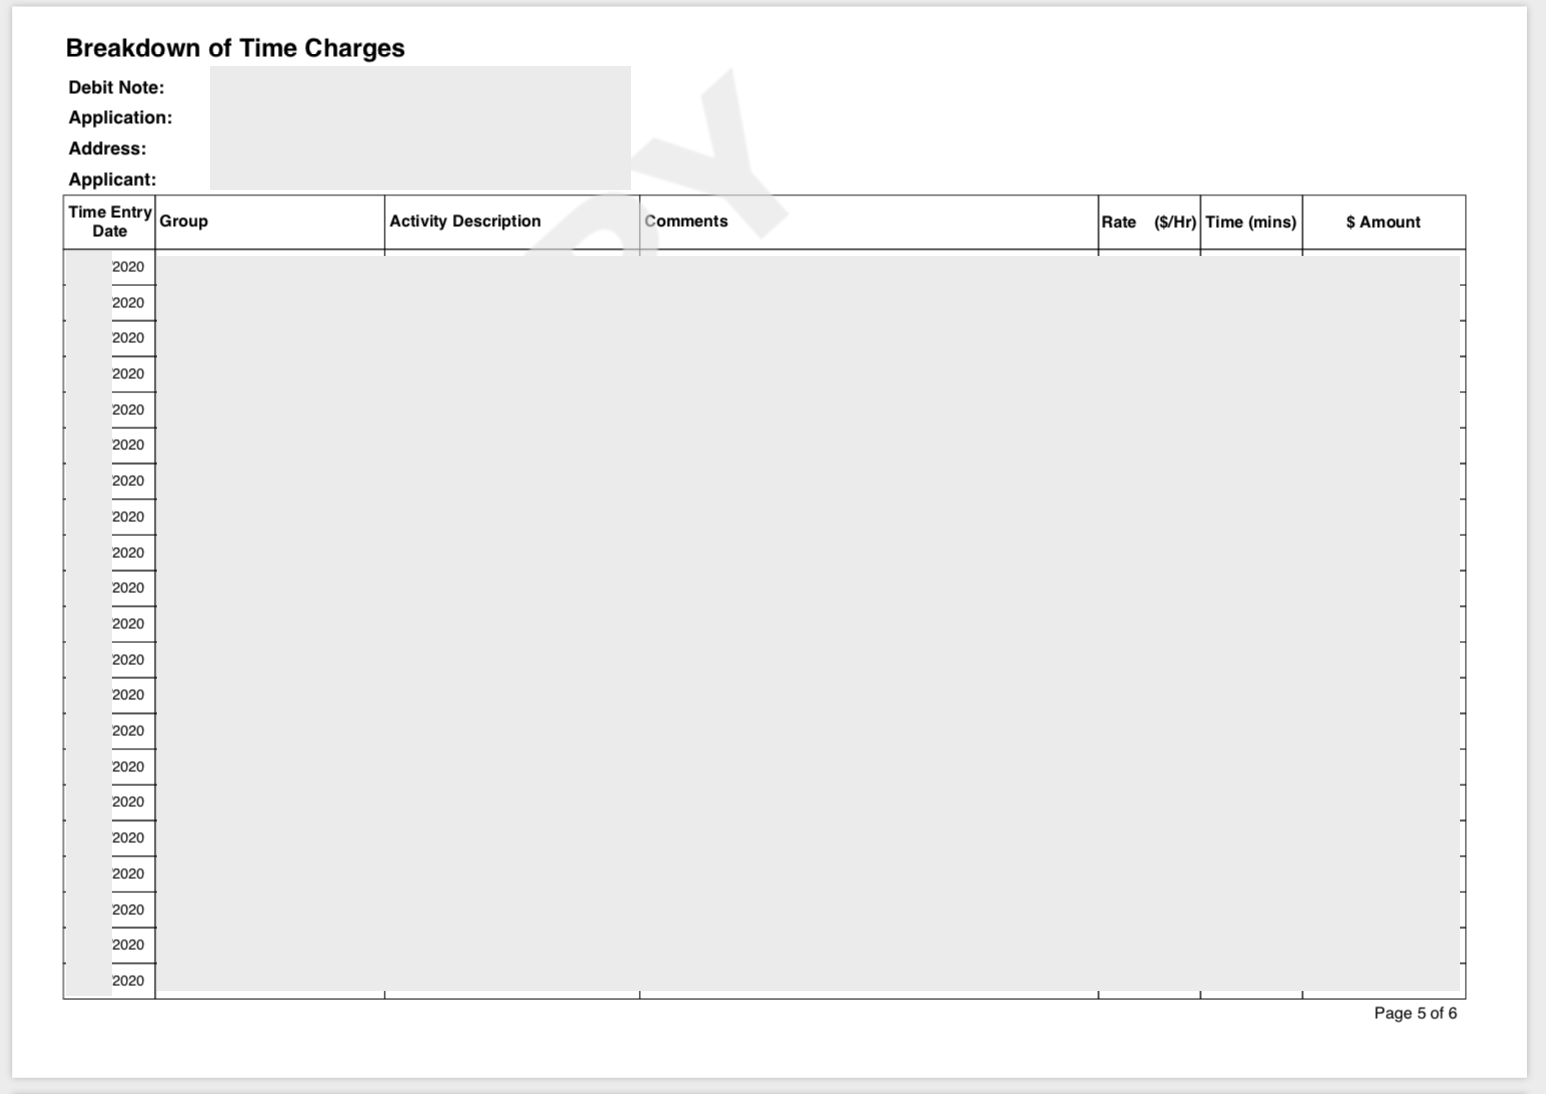
Since this was a single PDF, with the data readable as text, it looked like the Python library pdfreader would be able to handle it. I had considered training a model with PyTorch using a neural-network to perform OCR, but luckily that wasn’t necessary.
Next I had to work out how to store the data. I had a quick visual inspection of the invoice PDF and saw it had around 80 invoice lines. I considered SQLite but I didn’t want to be held back if performance needed to scale. Instead, I spun up a fresh Amazon Redshift cluster so that multiple nodes could perform data analysis without being bottlenecked by the database. I made sure to use SQLAlchemy as an ORM to be database agnostic, as well as Alembic to automate schema upgrades. This would mean the solution would be future-proof.
Once the infrastructure was set up I spent a day or so developing the code to extract data from the PDF. After some performance optimisation and implementing a caching layer, the PDF to Redshift transformation/ingestion (a.k.a. "ETL") took just a few seconds.
Analysis
After discussing with the client what information he wanted to see, I wrote some basic SQL queries to generate the data. We reviewed the sample results and once we agreed that the information looked correct I translated the queries to Apache Spark. This would allow me to perform the analysis required with horizontal scaling for extra performance.
Presentation
To make this much easier for the client to understand, I created a web front end for him to interact with. D3.js was used for interactive charts, and it sat on Django, which provided a REST API as a Spark/Redshift intermediary.
All in all, the project took only a few weeks and the client was happy to pay ongoing AWS costs for the enterprise level architecture and hosting.
Except, most of what you just read didn’t happen. If you haven’t guessed by now, this is a bit of a tall tale…
What really happened
The client with the problem is true, the over-engineered solution is just tech fantasy.
Here’s how I actually made the data available for analysis.
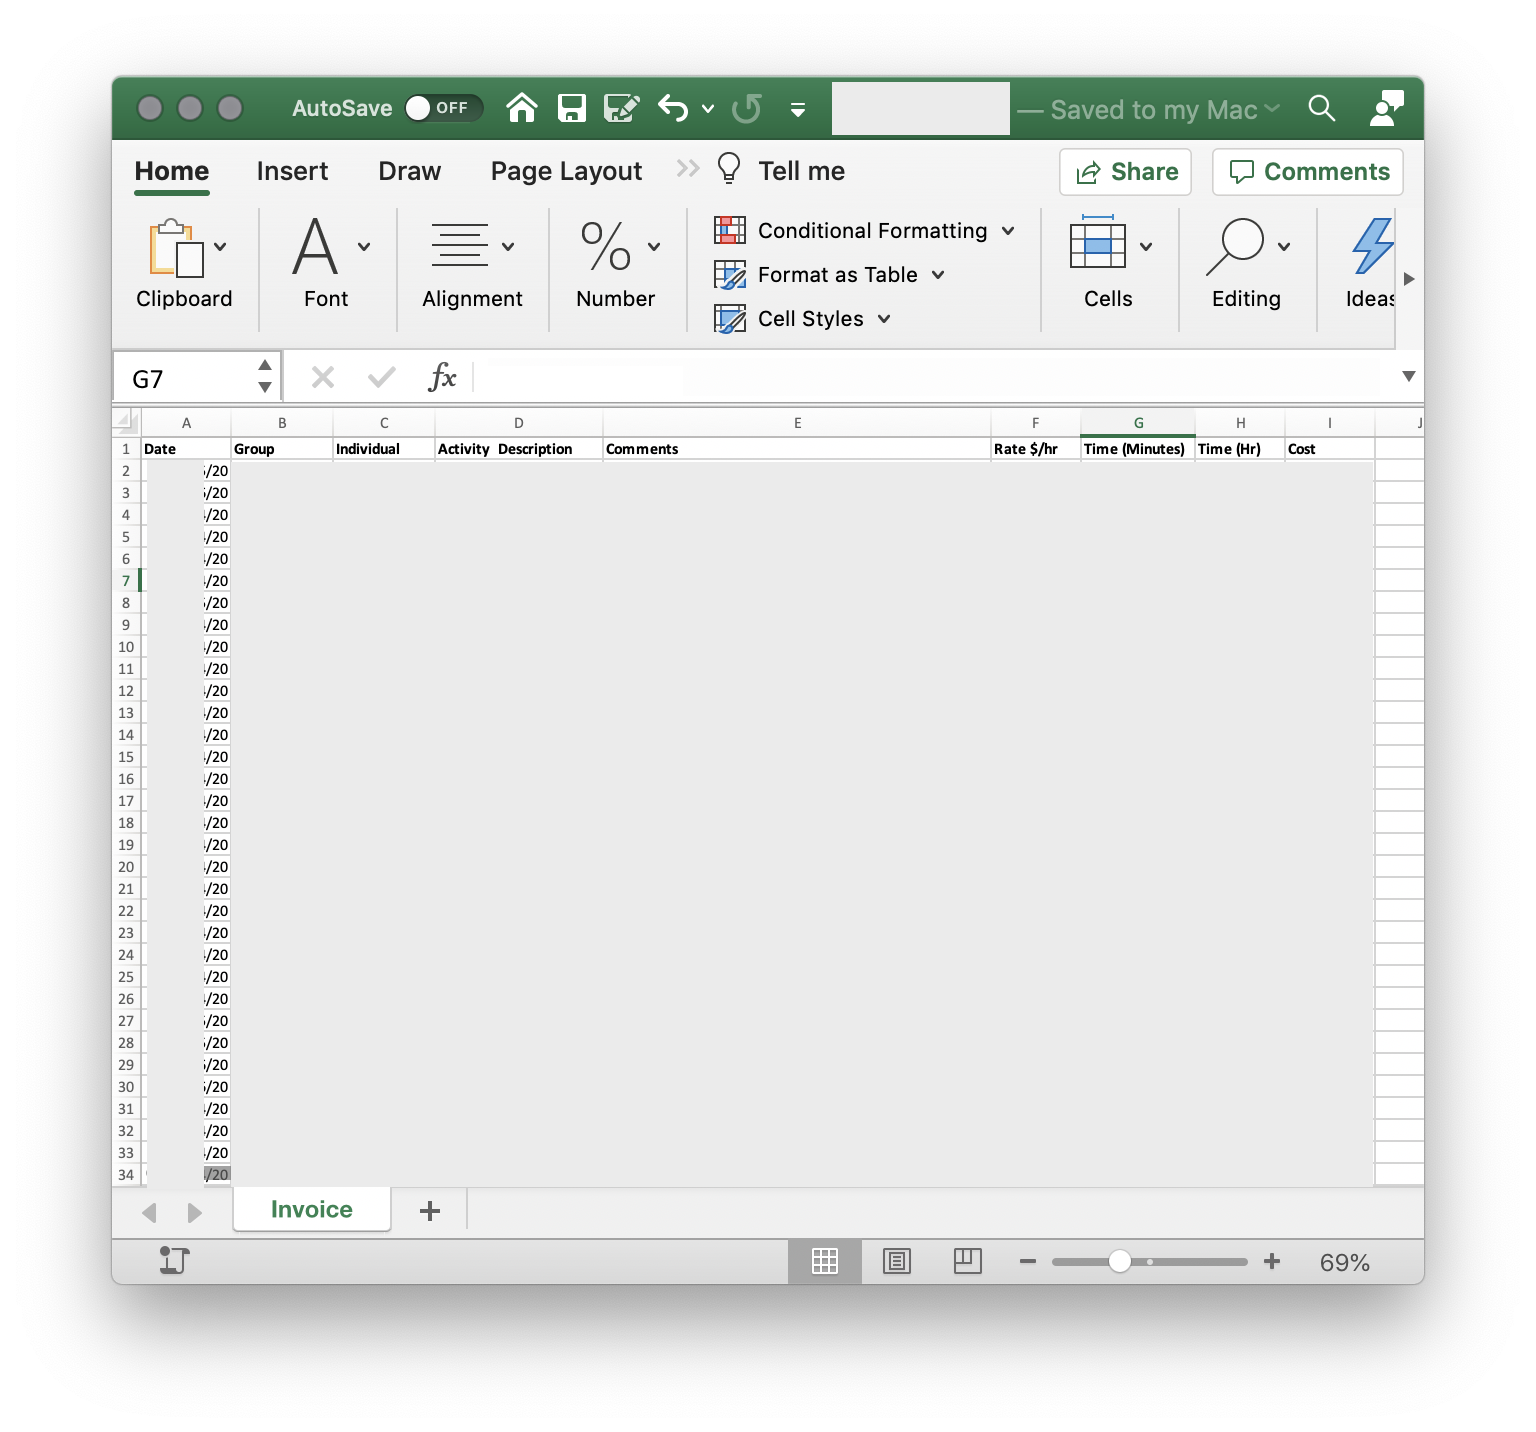
- Opened the PDF in Preview.
- Selected the invoice lines.
- Pasted into Excel.
- Typed in some column headers, deleted some blank rows, and sent it to the client
Of course, as a developer or engineer, our first thought is to play with all the cool toys and build an awesome high-tech solution. And I do admit, playing with the technologies I have mentioned and building massive data analysis behemoths can be fun.
But we have to remember that ultimately we are providing solutions to our customers, and this customer was perfectly happy with a simple Excel spreadsheet that he could sort and filter using a tool he was familiar with.
I wrote this post as a reminder that the most technical way to do something is not always the best, and sometimes the "old-fashioned" manual way can work just fine. We just have to take a step back and look at the bigger picture sometimes, instead of diving right in to the deep end (that’s a lot of metaphors in one sentence!).
Ultimately the work took me only around five minutes to do, and because of my good ongoing relationship with the client I provided it for no charge. In fact, a few weeks later he asked me to perform a similar analysis for another job of his.
Now, if he comes back a third time, I may just have to fire up the Redshift cluster after all…
About Tera Shift
Tera Shift Ltd is a software and data consultancy. We help companies with solutions for development, data services, analytics, project management, and more. Our services include:
- Working with companies to build best-practice teams
- System design and implementation
- Data management, sourcing, ETL and storage
- Bespoke development
- Process automation
We can also advise on how custom solutions can help your business grow, by using your data in ways you hadn’t thought possible.
About the author
Ben Shaw (B. Eng) is the Director of Tera Shift Ltd. He has over 15 years’ experience in Software Engineering, across a range of industries. He has consulted for companies ranging in size from startups to major enterprises, including some of New Zealand’s largest household names.
Email ben@terashift.co.nz